I want to be financially free someday. And to do that, I need to figure out how to get my money working for me. I can’t constantly fritter it away and it can’t sit idly in a vault. It needs to go out into the world, work, and bring more money back.
So, I’ve embarked on a self-educating adventure. I want to find the places where I can start putting money to work. I’m conservative by nature, and I haven’t got a lot of money to begin with, so I’m probably not going to invest in some brand new business venture. But, investing in stocks seems like a simple, relatively safe, first step.
And I mean investing. I don’t have any interest in trading and trying to make my gain off market forces of supply and demand. I want to find a few decent, durable, reliable companies and buy a piece or two of them. I want to see them grow, and pay me in dividends and in the growing value of my stock in them.
To that end, I’ve spent the last week or two looking at the financial statements of a different company each day. Mostly, this is training exercise for me. I’m learning where to find the statements, how to evaluate them, how to compare two companies’ different statement, and the variety of ways companies structure their finances.
I suppose this could be boring work for some, but I find it fascinating. I’ve focused mostly on companies I interact with regularly: Apple, Microsoft, Amazon, Google, Facebook, Coca-Cola, Twitter, and others. I look at their most recent statements, either their quarterly or annual. And so far, I’ve focused on their Income statements and Balance Sheets.
I’ve found that I can easily get these statements directly from the SEC via a system called EDGAR. These statements are awesome and come in three basic forms. The most detailed is an iXBR format (I think they call it) that presents the data as an elaborate web page with hyperlinks to define numbers and filtering to get at exactly the piece of data you seek.
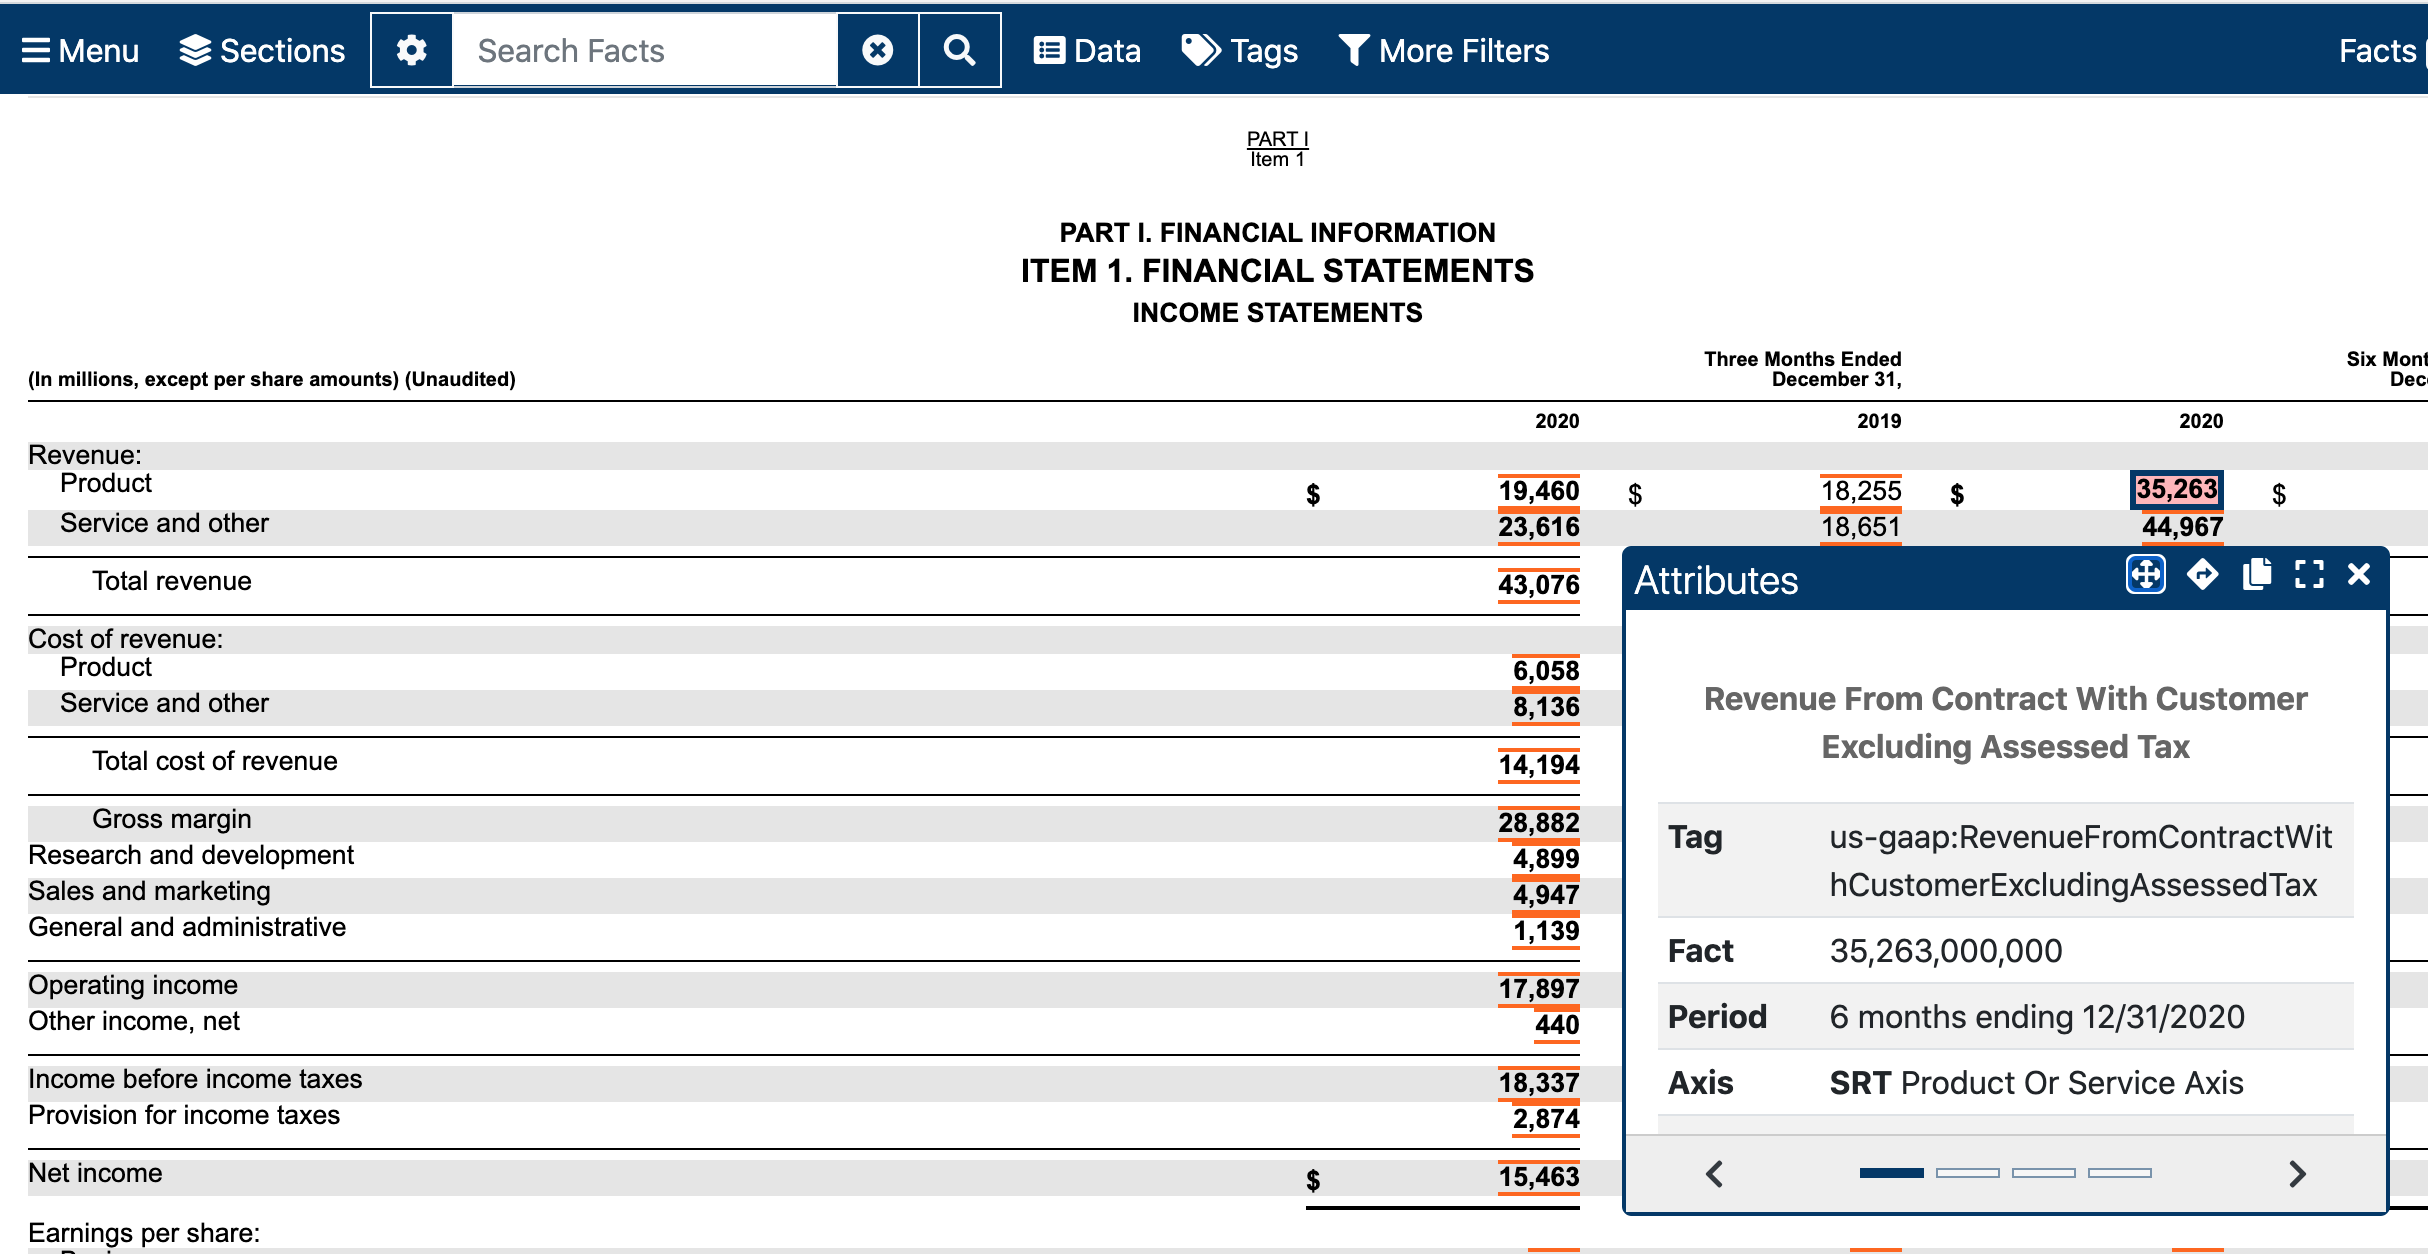
It’s almost too much information, but it’s useful when I need to find something specific or understand what I’m looking at. In contrast, the Interactive Data format is a more concise presentation of the data. The lack of clutter makes it easy to see the numbers.

But my favorite format is XLSX. Right up there above the sidebar on the Interactive Data format, is a link to “View Excel Document.” That gets me all of the same data in a workbook where I can format it, clean it up, and calculate from it to my heart’s content.
This gives me the power to compare two different businesses. I start by going through the Income Statement and the Balance Sheet, defining names on specific cells. Did you know you can do this? A lot of people don’t because it’s something of a hidden feature.

After selecting one or more cells in a workbook, you can right-click and select “Define Name” from the pop-up menu. You can also find this as a button on the Formulas ribbon. Using this feature, you can give a specific name to the region of selected cells and refer to it anywhere you’d like to use it in calculations throughout your workbook. So, instead of writing a calculation to define “Current Ratio” as “=$B$7/$B$20”, you can write something more meaningful, like “=Current_Assets/Current_Liabilities”.
After naming several key cells, I then start breaking down the sheets a bit. In the Income Statement, my goal is to understand how efficiently the company operates. How much of their revenue do they retain? And where do they spend their money? On the Balance Sheet, my goal is to understand how the company structures its finances. Do they keep money on hand? Do they have a lot of property? Do they rely more on debt or on equity?
To compare different companies, I express the numbers as percentages. On the Balance Sheet, for example, next to each value, I calculate that value as a percentage of its relevant section. Say, Accounts Receivable, an asset, is in B4. In B5, I’ll enter the calculation “=(B4/Total_Assets)*100”. I divide all of the values in the assets section by “Total Assets” and everything in the liabilities and equity section by “Total Liabilities and Shareholders’ Equity”.

Finally, I go through and do some formatting to make it easier to parse the data. I remove trailing decimals, I bold various totals, and I increase the font size on major sections’ totals. The end result is a workbook that I can compare to another company’s workbook so that I can understand how they equate to one another. I can see where one company has 80% of its business finances on liabilities while another company has only 20%. I can see where one company spend 50% of its income on R&D while another only spends 5%. All of this, hopefully, helps me know which of the two is in a better financial and operating position, and is, therefore, a safer company to invest in.
Really, this is all a learning exercise. Fidelity, my brokerage, does a lot of this for me. I can just look at the data they’ve compiled. But at this stage, I find it useful to do it myself. It helps me understand where the numbers come from and how they work. It also gives me some freedom to explore beyond what my brokerage provides.
And it’s been fascinating to see how different companies work. Even when I don’t know all that there is to know about a company, I have a much better sense, after looking at the finances, of which company is a safer investment. I have a better sense of the company’s longevity. And I understand better how it operates.
In the weeks ahead, I hope to use this information to give me the confidence to make some first, serious forays into the stock market. And in the years ahead, I hope to build on this foundation, perhaps to invest in developing a business that can deliver greater returns. All told, I believe financial freedom is possible with the right work.
